

Prerequisites
Before you begin, make sure you have:- A LangSmith account: Sign up or log in at smith.langchain.com.
- A LangSmith API key: Follow the Create an API key guide.
- An OpenAI API key: Generate this from the OpenAI dashboard.
1. Set up your environment
-
Create a project directory, install the dependencies, and configure the required environment variables:
-
Export your environment variables in your shell:
To send traces to a specific project, use the
LANGSMITH_PROJECTenvironment variable. If this is not set, LangSmith will create a default tracing project automatically on trace ingestion. In an agent-based workspace, the first trace to a new project name, including the default project, creates an agent named after the project, with the project as its Production environment. The agent’s identifier is derived from the project name, so it can differ from the project name, and creating the agent requires permission to create projects. To name the agent and the environment directly instead, see Log traces to an agent.If you are using Anthropic, use the Anthropic wrapper. If you are using Google Gemini, use the Gemini wrapper. For other providers, use theIf your account is in a region other than US (the default), also setLANGSMITH_ENDPOINTto the API URL for your region. Without this, your API key won’t be recognized and requests will fail to authenticate.
For example, EU accounts:Region GCP US GCP EU GCP APAC AWS US export LANGSMITH_ENDPOINT="https://eu.api.smith.langchain.com".@traceabledecorator to trace calls manually.
2. Build the app
The following app uses two LangSmith tools to add tracing:- OpenAI wrapper: wraps the OpenAI client so every LLM call is automatically logged as a nested span.
- Traceable wrapper: wraps a function so its inputs, outputs, and any nested spans appear as a single trace in LangSmith. Use
@traceablein Python,traceablein TypeScript and Kotlin, andTracing.traceFunctionin Java.
assistant function calls a tool (get_context) to retrieve relevant context, then passes that context to the model. Using the traceable wrapper on both functions captures the full pipeline in one trace, with the tool call and LLM call as nested spans.
Create a file called app.py, index.ts, App.java, or App.kt with the following code:
3. Run the app
4. View your trace
In the LangSmith UI, go to Tracing and select your default project. In an agent-based workspace, select your agent in the top bar first, then go to Tracing. For more information, see Navigate agents. Click theassistant row to open the trace. The Trajectory tab shows the conversation as it was sent to the model. Select the Details tab to see the full run tree, including the assistant function with the get_context tool call and the OpenAI call nested inside it.
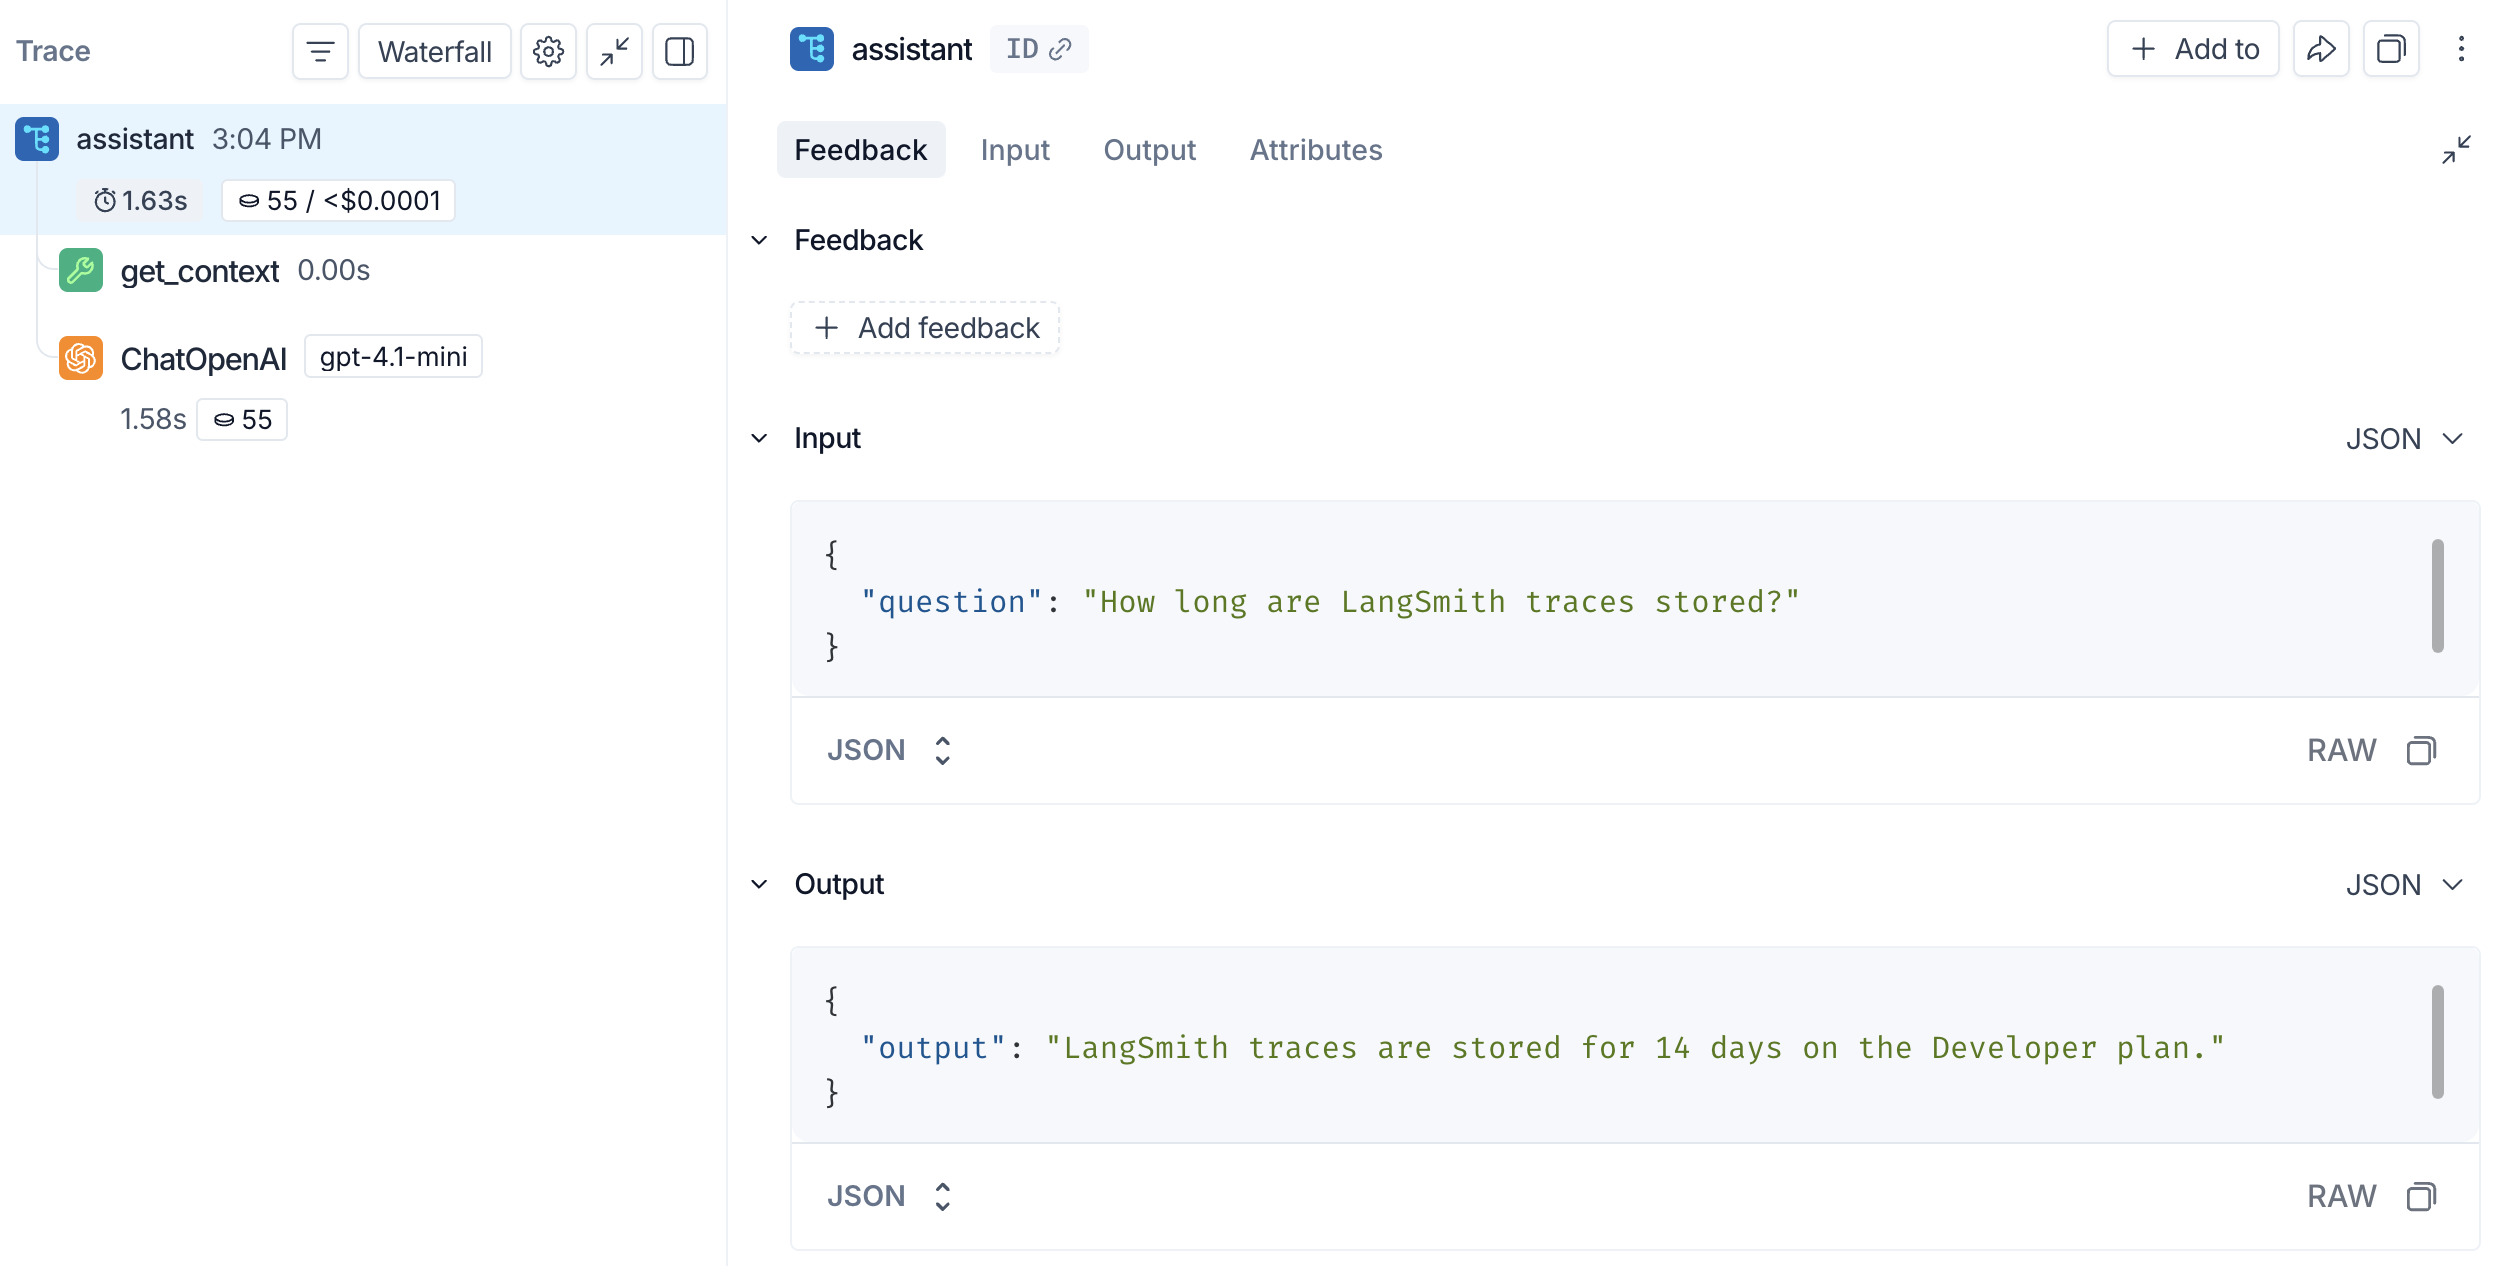
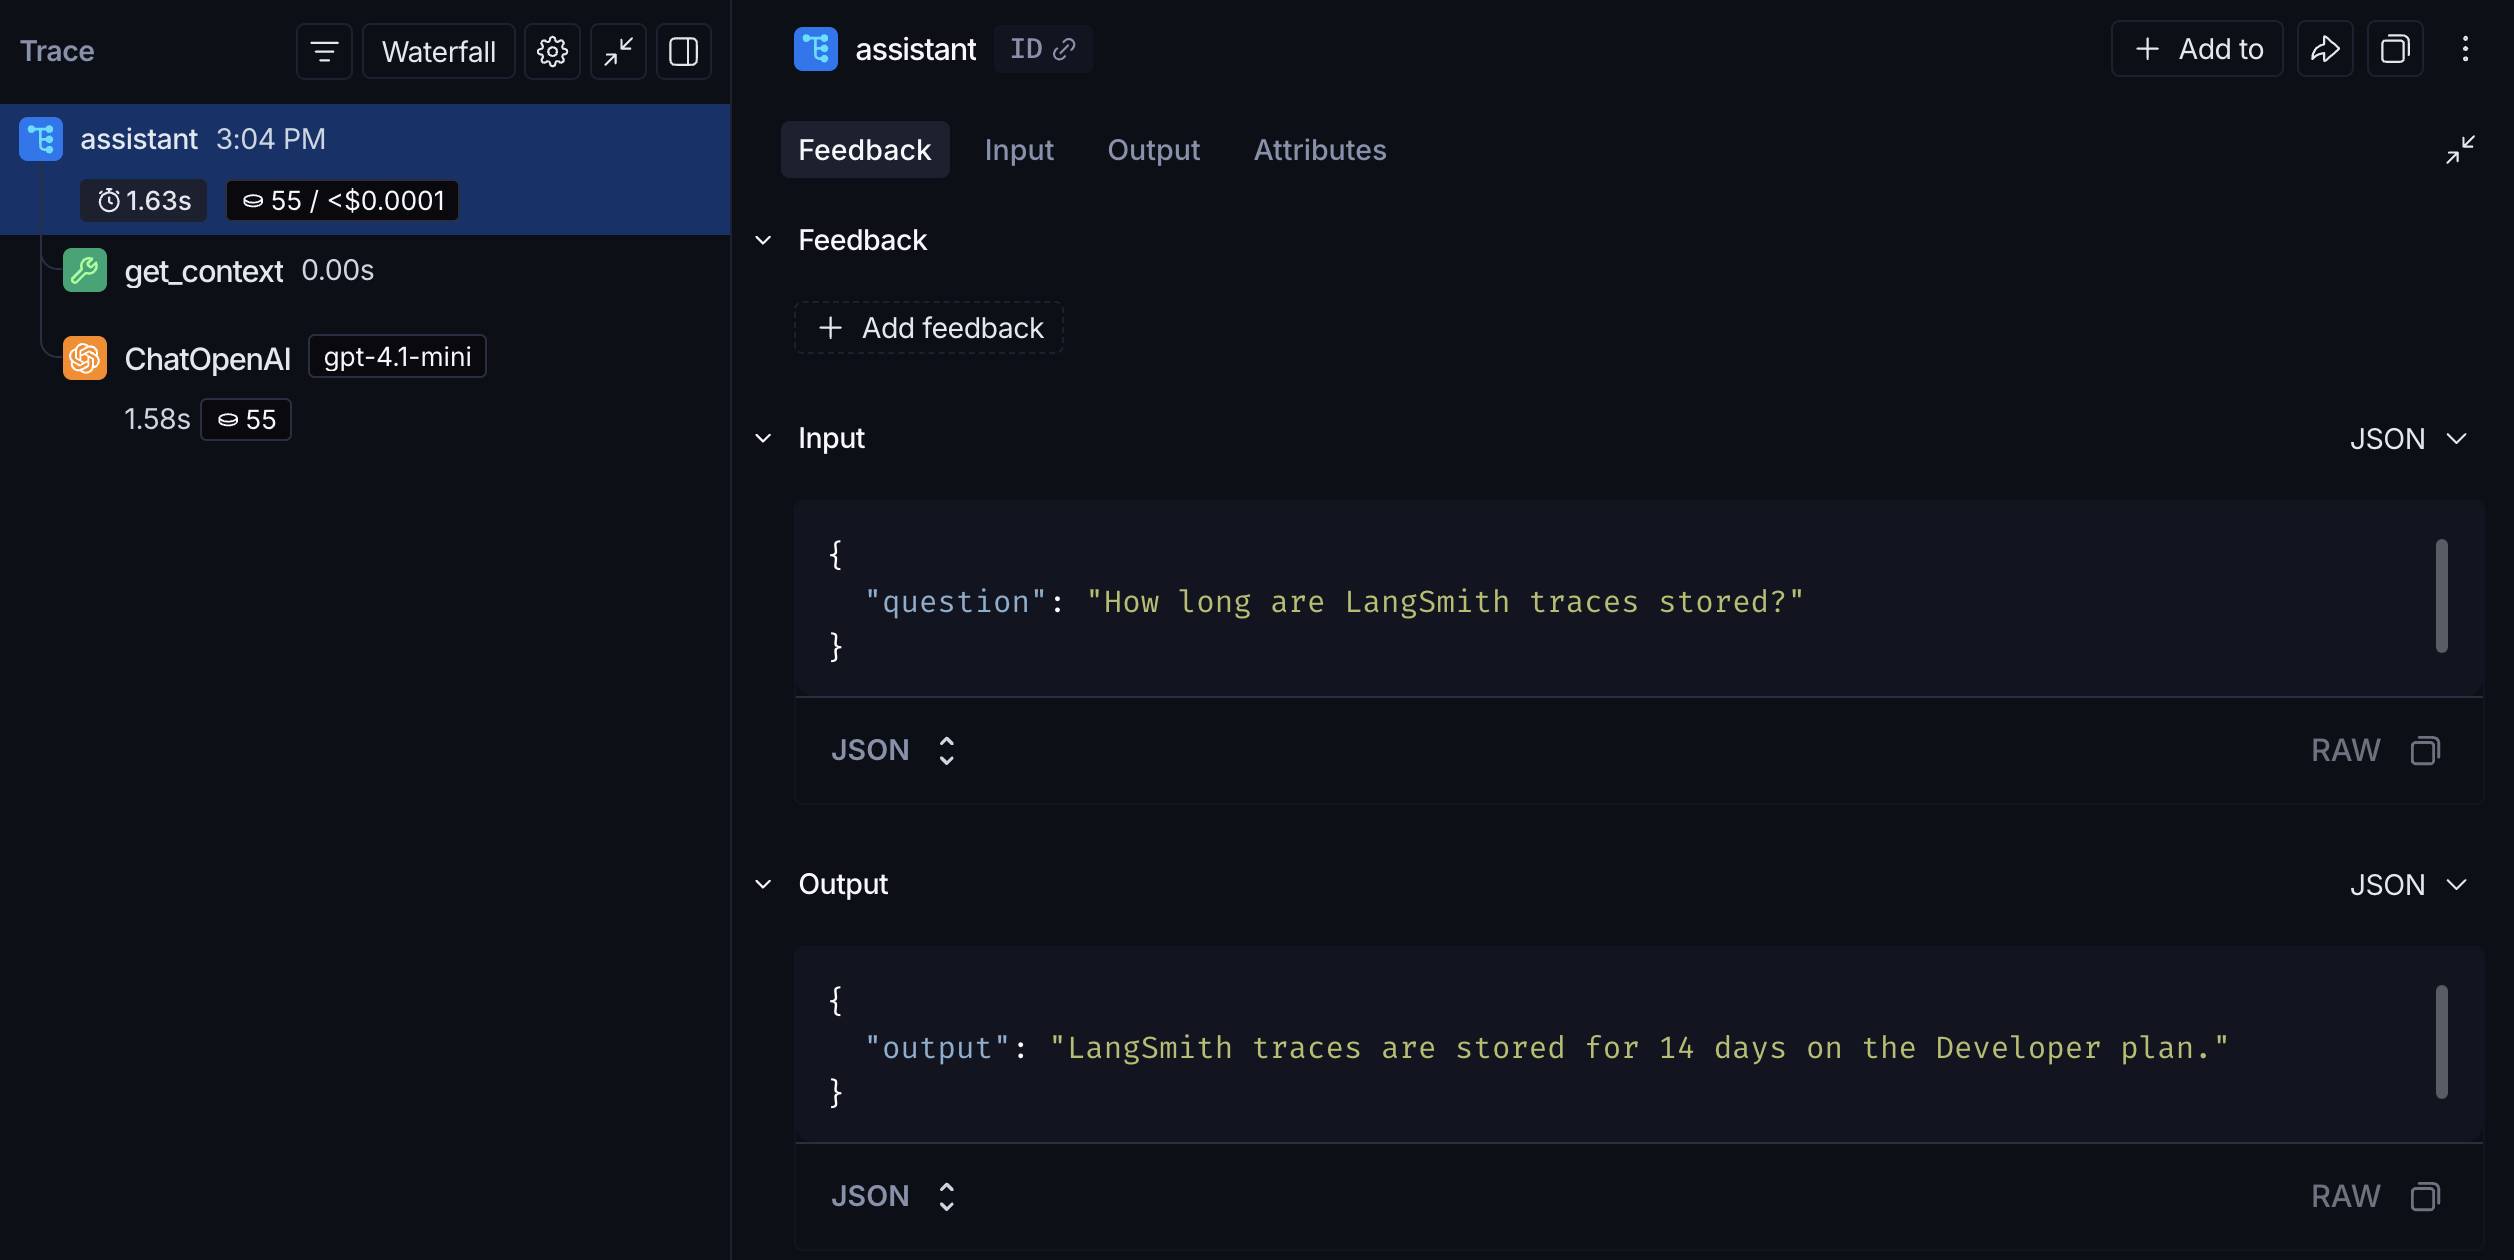
assistant function’s inputs and outputs. The nested get_context span records the tool call, and the ChatOpenAI span records the exact prompt sent to the model and the response returned.
Next steps
- Tracing integrations: LangChain, LangGraph, Anthropic, and other providers.
- Trace an LLM application: a full lifecycle tutorial, from prototyping through production.
- Filter traces: search and navigate large tracing projects.
- Log to a specific project: send traces to a named project instead of default.
- Agents: how an agent groups the traces, datasets, and monitors of one application, and how its environments divide them.
After logging traces, use Chat to analyze them and get AI-powered insights into your application’s performance.
Connect these docs to your agent of choice via MCP for real-time answers.